
Ironman Bike Time Chart: Finish Predictions by FTP and Weight
Predict your Ironman 180km bike split using our time chart. Find finish times based on FTP (150-350W), weight, and course conditions.
Knowing your expected Ironman bike time helps you plan nutrition, set realistic goals, and execute a race strategy that sets up your marathon. This guide provides time predictions based on your FTP, weight, and course conditions.
How to Predict Your Ironman Bike Time
Your Ironman bike split depends on several factors:
- FTP (Functional Threshold Power) - Your sustainable power output
- Weight - Especially important on hilly courses
- CdA (Aerodynamic drag) - Your position and equipment
- Course profile - Elevation gain and terrain
- Conditions - Wind, temperature, altitude
For precise predictions, use our Ironman Bike Split Calculator which accounts for all these factors.
Ironman Bike Time by FTP
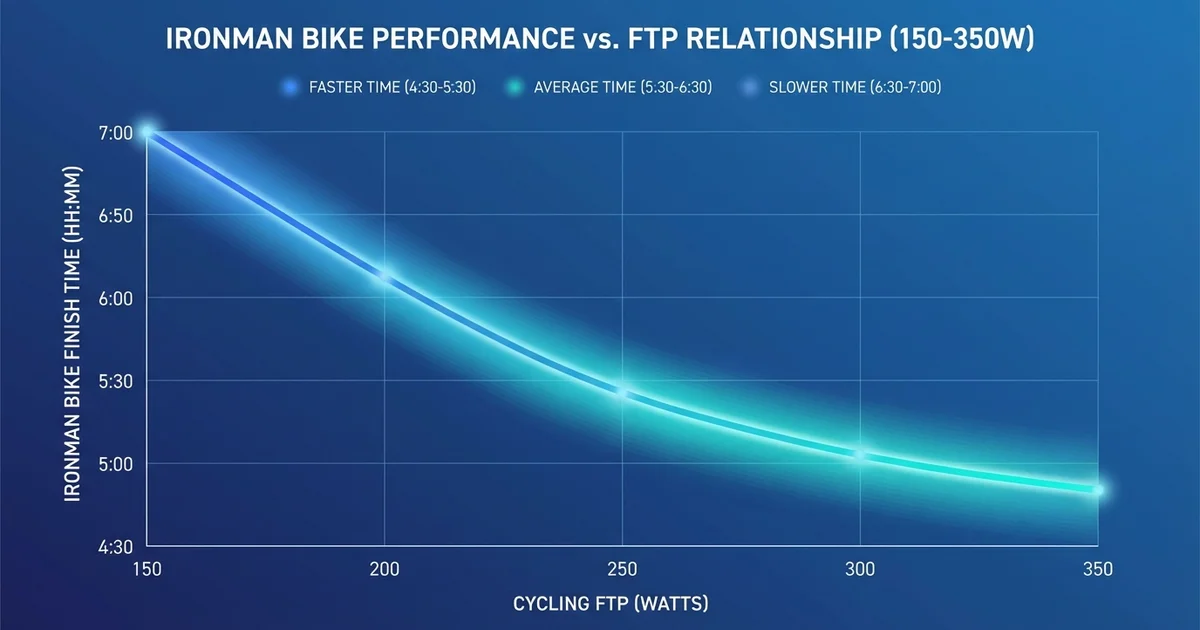
The following chart shows expected 180km bike times at typical Ironman race intensity (IF 0.70-0.75) on a flat course:
| FTP (Watts) | IF 0.70 Power | IF 0.75 Power | Expected Time Range |
|---|---|---|---|
| 150W | 105W | 113W | 6:45-7:15 |
| 175W | 123W | 131W | 6:15-6:45 |
| 200W | 140W | 150W | 5:45-6:15 |
| 225W | 158W | 169W | 5:20-5:50 |
| 250W | 175W | 188W | 5:00-5:30 |
| 275W | 193W | 206W | 4:45-5:10 |
| 300W | 210W | 225W | 4:30-5:00 |
| 325W | 228W | 244W | 4:20-4:45 |
| 350W | 245W | 263W | 4:10-4:35 |
Note: These times assume a flat course, 75kg rider, and TT bike with good aero position (CdA ~0.25).
Time Chart by Athlete Category
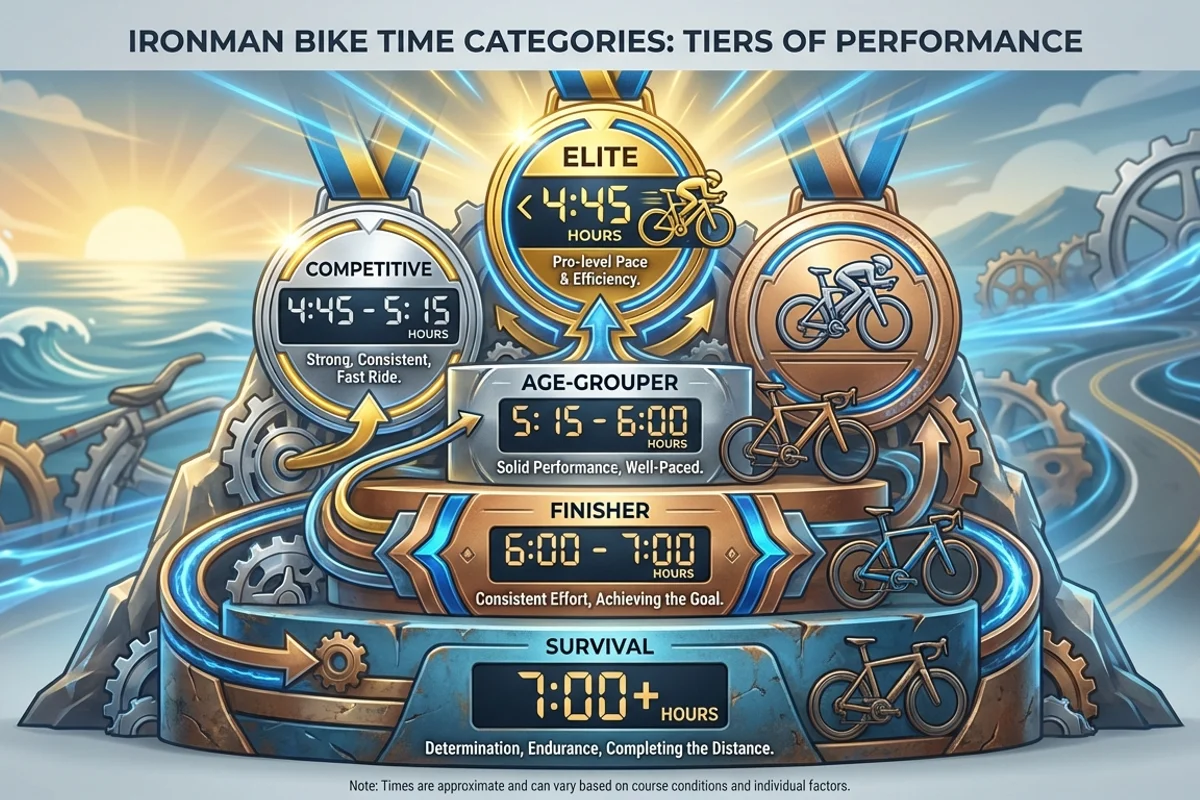
Use this chart to understand where your predicted time falls:
| Category | Bike Time | Typical FTP | Characteristics |
|---|---|---|---|
| Elite / Pro | <4:30 | 320W+ | Full-time athletes, optimal equipment |
| Competitive AG | 4:30-5:15 | 260-320W | Experienced, well-trained age groupers |
| Age Grouper | 5:15-6:00 | 200-260W | Dedicated recreational triathletes |
| Finisher | 6:00-7:00 | 150-200W | First-timers, building fitness |
| Survival | 7:00+ | <150W | Completing the distance is the goal |
Where Should You Target?
First Ironman: Target the conservative end of your predicted range. A 6:00 bike that leads to a 4:30 run beats a 5:30 bike that leads to a 6:00 run.
Experienced: You can push closer to the fast end if you've proven your run durability in training and previous races.
Impact of Weight on Bike Time
Weight matters most on hilly courses. Here's how body weight affects predicted times:
Flat Course (< 500m elevation)
| Rider Weight | Time Impact vs 75kg |
|---|---|
| 60kg | -2 to -5 min |
| 70kg | -1 to -2 min |
| 75kg | Baseline |
| 80kg | +1 to +2 min |
| 90kg | +3 to +5 min |
Hilly Course (1500m+ elevation)
| Rider Weight | Time Impact vs 75kg |
|---|---|
| 60kg | -8 to -15 min |
| 70kg | -4 to -8 min |
| 75kg | Baseline |
| 80kg | +5 to +10 min |
| 90kg | +10 to +20 min |
Key insight: On flat courses, aerodynamics matter more than weight. On hilly courses, watts per kilogram (W/kg) becomes the dominant factor.
Wind Impact on Ironman Bike Times
Wind can dramatically affect your bike split. Here's what to expect:
| Wind Condition | Speed | Typical Impact |
|---|---|---|
| Calm | 0-10 km/h | Baseline |
| Light | 10-20 km/h | +5-10 min |
| Moderate | 20-30 km/h | +10-20 min |
| Strong | 30+ km/h | +20-35 min |
Direction Matters
- Pure headwind: Maximum time loss
- Pure tailwind: Time gain (but less than headwind loss)
- Crosswind: Moderate impact, handling challenges
- Variable/changing: Hard to predict, usually net time loss
Pro tip: On windy courses, target power output rather than speed. Maintain your IF regardless of how fast (or slow) you're moving.
Course Profile Time Adjustments
Flat Courses (< 500m elevation gain)
Best for: Heavy riders, low W/kg, strong time trialists
| Course | Expected Time (250W FTP, 75kg) |
|---|---|
| Frankfurt | 5:05-5:20 |
| Texas | 5:00-5:15 |
| Florida | 5:00-5:20 |
| Kalmar | 5:10-5:25 |
Rolling Courses (500-1000m elevation)
Balanced between aero and climbing
| Course | Expected Time (250W FTP, 75kg) |
|---|---|
| Barcelona | 5:15-5:35 |
| Cairns | 5:20-5:40 |
| Hamburg | 5:10-5:30 |
| Copenhagen | 5:10-5:30 |
Hilly Courses (1000-1500m elevation)
Favors: Lighter riders, high W/kg
| Course | Expected Time (250W FTP, 75kg) |
|---|---|
| Nice | 5:30-5:55 |
| Wales | 5:40-6:05 |
| Weymouth | 5:25-5:50 |
| Tallinn | 5:30-5:55 |
Mountainous Courses (1500m+ elevation)
Significant climbing emphasis
| Course | Expected Time (250W FTP, 75kg) |
|---|---|
| Austria | 5:35-6:00 |
| Lanzarote | 5:45-6:15 |
| Switzerland | 5:40-6:10 |
Calculate Your Exact Time
While these charts provide useful estimates, every athlete and course is different. For precise predictions:
Step 1: Know Your Numbers
- FTP: From a recent test (FTP Calculator)
- Weight: Current race weight (rider + bike)
- CdA: From testing or use typical values (0.25-0.30)
Step 2: Get Course Data
Download your race course GPX from the official race website or Strava.
Step 3: Use the Calculator
Upload your GPX to our Ironman Bike Split Calculator and enter your parameters. The physics-based model will give you:
- Predicted finish time
- Segment-by-segment breakdown
- Power targets for each section
- Wind impact analysis
Setting Realistic Time Goals
Conservative Approach (Recommended)
Use the slower end of your predicted range:
- Less risk of blowing up
- Better run performance
- More consistent pacing
- Mental boost from "ahead of plan"
Aggressive Approach (Experienced Only)
Use the faster end if:
- You've proven run durability
- Course conditions are ideal
- This is a key race with taper
- You have multiple Ironman finishes
Related Resources
Calculators
- Ironman Bike Split Calculator - Course-specific predictions
- Ironman Time Calculator - Overall finish time
- FTP Calculator - Know your threshold
Pace Charts
- Ironman Bike Pace Chart - Speed-based reference
- Ironman Bike Split Chart - Segment targets
Training Guides
- Ironman Bike Training Guide - How to prepare
- Ironman Pacing Strategy - Race execution